Dark Matter
Every engine

What the terminal reads, and when it refuses.

The long version of the home page: every engine, its method, and where its history starts. The years below are read from the live context layer; where it doesn’t answer, a line carries no year.

The method

Everyone else trades the headline. You trade the source.

No hindsight baked in.

Every filed fact is stored with the date it became public, so history here looks the way it looked at the time, not the cleaned-up version published later.

Click any number, see the proof.

Every figure opens up: the inputs, the models that ran, the filing underneath. Where the data is missing, the engine says so, instead of quietly making something up.

Ranked against its own history.

“High” only means something against history. Every reading is ranked against its own record, some series back to 1871, and a percentile is withheld until 120 observations exist.

An AI that shows its work.

Oracle answers from the engines and names every source it used. Open them, check them, disagree with it: the only AI worth trading alongside is one you can audit.

The index

Every engine, on one login.

Strategy discovery & validation

  • Unattended research campaigns that write, code and test their own strategy ideas
  • A gauntlet of statistical gates, several of them hard fails
  • Permutation and block-bootstrap tests, plus overfitting checks, with no shortcuts
  • A factor library collapsed to uncorrelated representatives
  • A multi-source daily price warehouse
  • Paper deployment on a dedicated always-on runner

Institutional positioning

  • Superinvestor funds read straight from EDGAR 13F, each diffed against its own prior filing
  • Positions summed per security before any ranking is taken
  • The SEC Form 4 insider tape and independent-buyer clusters
  • Off-exchange volume from FINRA’s weekly ATS file
  • US House periodic transaction reports

Filed fundamentals

  • Point-in-time intrinsic value: DCF, residual income, peer comps and a cross-sectional leg, plus a Monte Carlo band
  • Accounting quality: Beneish, Piotroski and Altman with every component published
  • Bottom-up S&P 500 valuation, name by name, withheld where the gate fails
  • Buyback execution checked against filed cover-page share counts
  • Merger arbitrage with terms parsed from the SEC document

Macro, rates & liquidity

  • Recession odds from the NY Fed’s own model, history back to 1982
  • Net Fed liquidity: Treasury account, reverse repo and bank reserves, back to 2003
  • CFTC positioning, keyless from the regulator
  • How close corporate America sits to default, measured daily
  • Growth/inflation regime and a measured economic calendar

Volatility & dealer positioning

  • Dealer gamma per strike from live CBOE chains
  • Crash and rally odds, read from live option prices
  • The variance risk premium, ranked against its own history, back to 1993
  • The VIX, its curve, and bond-market stress
  • Deribit BTC and ETH term structure and skew
  • A capture ledger that withholds a percentile until it has 120 observations

Energy balance

  • Weekly EIA crude balance, each figure tagged with its series id
  • Natural gas storage: an ensemble forecast against the Street
  • Refinery utilization, rig count and Cushing stocks
  • Crude build/draw forecasting that grades itself against the print

Crypto market structure

  • Pair scans across Binance and Hyperliquid on every run
  • Statistical gates every pair must pass; most fail
  • A local multi-venue warehouse of hourly bars
  • Funding rates flagged when they hit unusual extremes
  • Cash-and-carry basis that names its carry source per quote
  • On-chain flows, with any metric it cannot derive returned as null

Catch the buying the headlines miss.

When executives buy their own stock in the same week, that means something. When unusual options premium and off-exchange volume hit the same name, that means something. Insider tape, fund filings, options and off-exchange prints, scored where they agree.

Consensus table: each ticker scored across insider buying, 13F filings, options flow, dark-pool prints and congressional trades

Know the odds before you take the bet.

The options market prices the odds of every move. We read it live: the probability of a crash before expiry, the levels where dealers flip from selling into buying, and when protection is overpriced.

SPY risk-neutral probability density from the live option chain, with the crash and rally tails shaded

The market has seasons. Know yours.

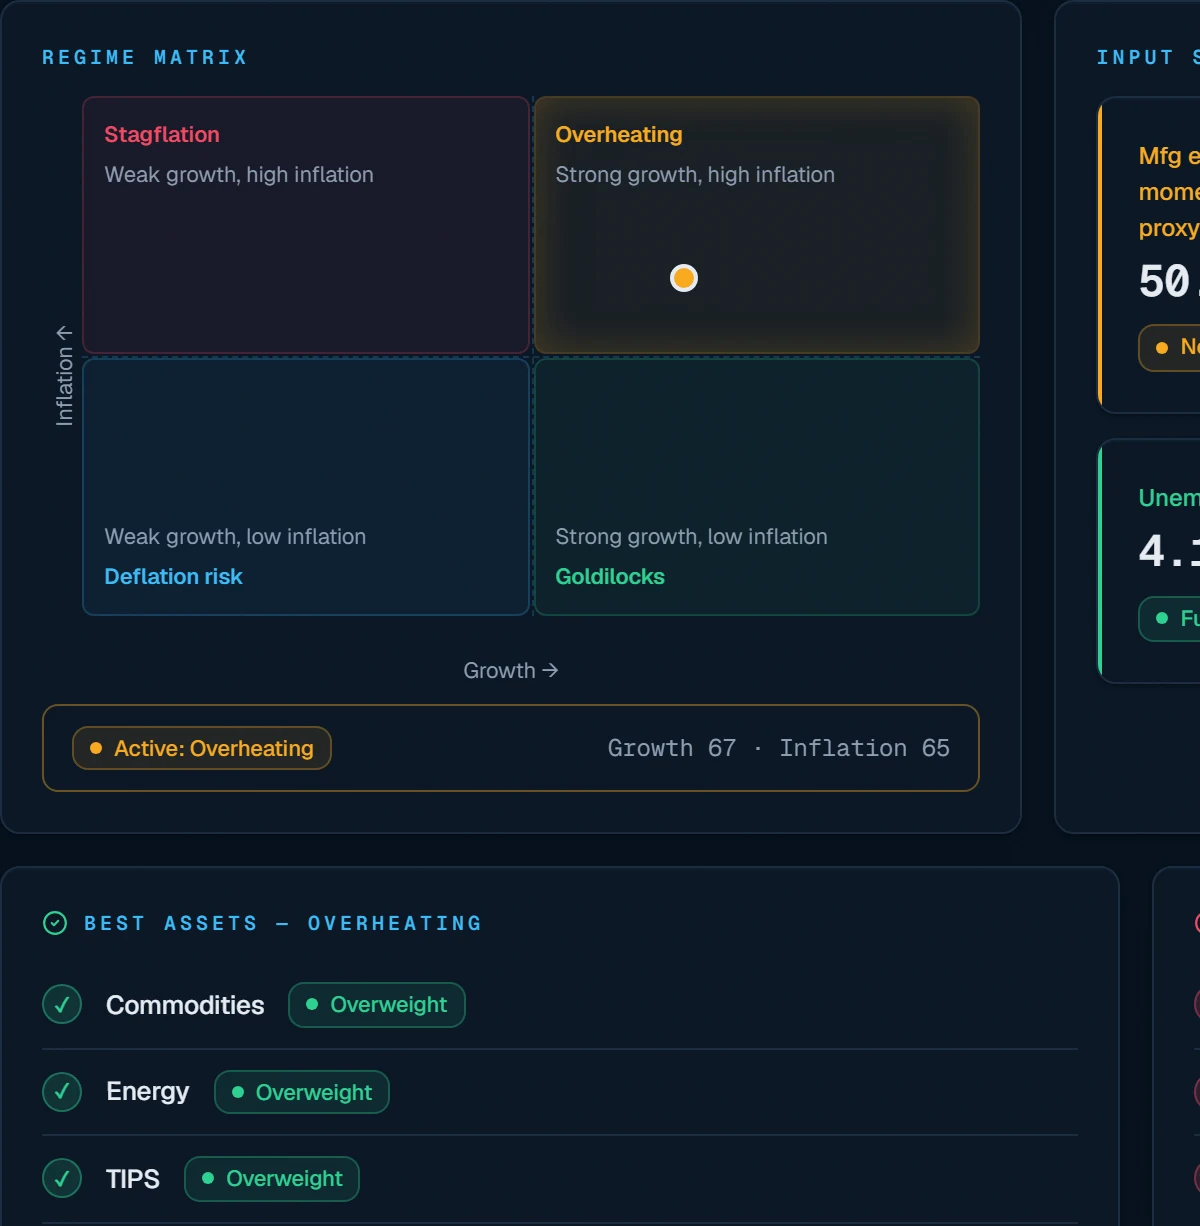
Growth up, inflation down? That regime rewards some trades and punishes others. The regime is classified live, recession risk is scored on the Fed’s own model, and you see what historically worked in exactly these conditions.

Macro regime matrix with the active growth-inflation quadrant, the indicator grid and the assets that led and lagged in that regime

Your analyst, watching every engine.

Oracle watches the engines so you do not have to. When a setup forms it says what fired, why, and at what level, in plain English with the evidence attached.

Oracle live signal grid across the engine set, with a triggered, confidence-scored setup

We keep score. Nothing deleted.

Every triggered setup is graded forward against what the market actually did. The record is append-only: nothing is backfilled and nothing is removed.

Confluence heatmap rolling engine states up by category: macro, volatility, liquidity, positioning, credit, equity, commodities

Unretouched captures of the product.

A real session, recorded

Ask it something. Watch where the answer comes from.

Recorded 27 June 2026 · unedited · the figures are that morning’s

“What is your full read on Microsoft (MSFT) right now?”

The answer names the drag on its own score, carries a coverage gap it could not close, and ends in the educational disclaimer it is required to — none of which a mockup has any reason to include. None of its figures is a current quote.

See it on your own tickers.

Free account · no card · the preview dashboards